I listen fairly religiously to the Hello Internet podcast with Brady Haran and CGPGrey. In the most recent episode, they discussed the recent UK election and how badly the UK voting system works to fairly represent the actual distribution of votes. This piqued my interest so I thought I would investigate how well Sweden performs in this regard.
Right off the bat (after refreshing my memory on how our voting system works…), I realized this wouldn’t really be a fair comparison. In order to understand why, get ready for a…
Crash Course in the Swedish Voting System
If you’re not interested in this part (why wouldn’t you be?!), you can skip down to the actual comparison. Although it might not make as much sense if you skip this.
Sweden’s allocation of seats in the Riksdag1 is explicitly designed (with some minor caveats) to be proportional to the number of votes each party has received. The UK on the other hand, uses First Past the Post voting which is what causes their representation disparity.
The basic system we have is fairly easy: The country is divided into a number of constituencies (historically there have been different number of constituencies but we currently have 29). There are 349 seats in the Riksdag, 310 of which are fixed constituency seats. These 310 seats are divided between the constituencies in relation to the number of people eligible to vote in each constituency. The remaining 39 seats are adjustment seats which I’ll explain a little later. To be in the running for any seats at all, a party needs at least 4% of the national votes or 12% in any single constituency.
In order to understand how seats are appointed to the different political parties, we need to make a …
Detour to the Sainte-Laguë method
The method used to calculate how many seats each party should receive is called the Sainte-Laguë method. Actually, Sweden uses a modified Sainte-Laguë method but the basics are the same. I’ll just explain it briefly here so if you’re interested in the specifics, read the Wikipedia article.
Sainte-Laguë is an iterative method. For each iteration, you calculate a quotient for each party according to the following formula:
quot = V / (2*s + 1)
Where V is the number of votes the party has received and s is the
number of seats the party has been appointed so far. The party with the
largest quotient is awarded the seat in this iteration. Looking at the
equation, it’s obvious that the quotient is equal to the number of votes
in the first iteration. This is where the modification Sweden has made
comes in: For parties that has received zero seats, their vote count is
divided by 1.2 instead of 1.
It’s important (for the charts later in the article) to note that there
was a recent change to the election law in Sweden. Previously, the vote
count in the first iteration was divided by 1.4 instead of 1.2.
However, this change was voted into law after the 2014 general election
so the results I’ve looked at below uses the old value.
Appointing seats in Sweden
When votes are counted in each constituency, the Sainte-Laguë method is used to appoint the seats in the constituency.
When all the votes are counted and all constituencies have appointed their seats, the number of seats each party has received over all constituencies is tallied up. Next, the Sainte-Laguë method is used to simulate assigning all 349 seats but this time with the entire nation as a single constituency. The number of seats each party has received in the two different assignment processes is compared to see how good the representation is at a national level.
This is where the 39 adjustment seats come in to action. The parties that have received too few seats when the 310 fixed seats were appointed are given an adjustment seat in the constituency where it’s quotient is still largest after the 310 seat appointment. Conversely, if it has received too many seats, one is returned in the constituency where the party has the smallest quotient. One interesting note is that the appointment of the adjustment seats is done using the non-modified version of Sainte-Laguë.
Also, to preempt any comments about it: Yes, we can vote for specific persons in each constituency as well. I’m not going to dive into that process though, I’ll have to save you some rabbit holes to go down over at Wikipedia.
Wow! If you’re still here, you must be at least as much of a geek as I am. Now, onto the promised comparison between the UK and Sweden:
Comparison
Without further ado, here are the charts for Sweden:

You can look at the full Google Spreadsheet here. For reference, below are CGPGrey’s original charts for the UK. You can also look at his Numbers spreadsheet.
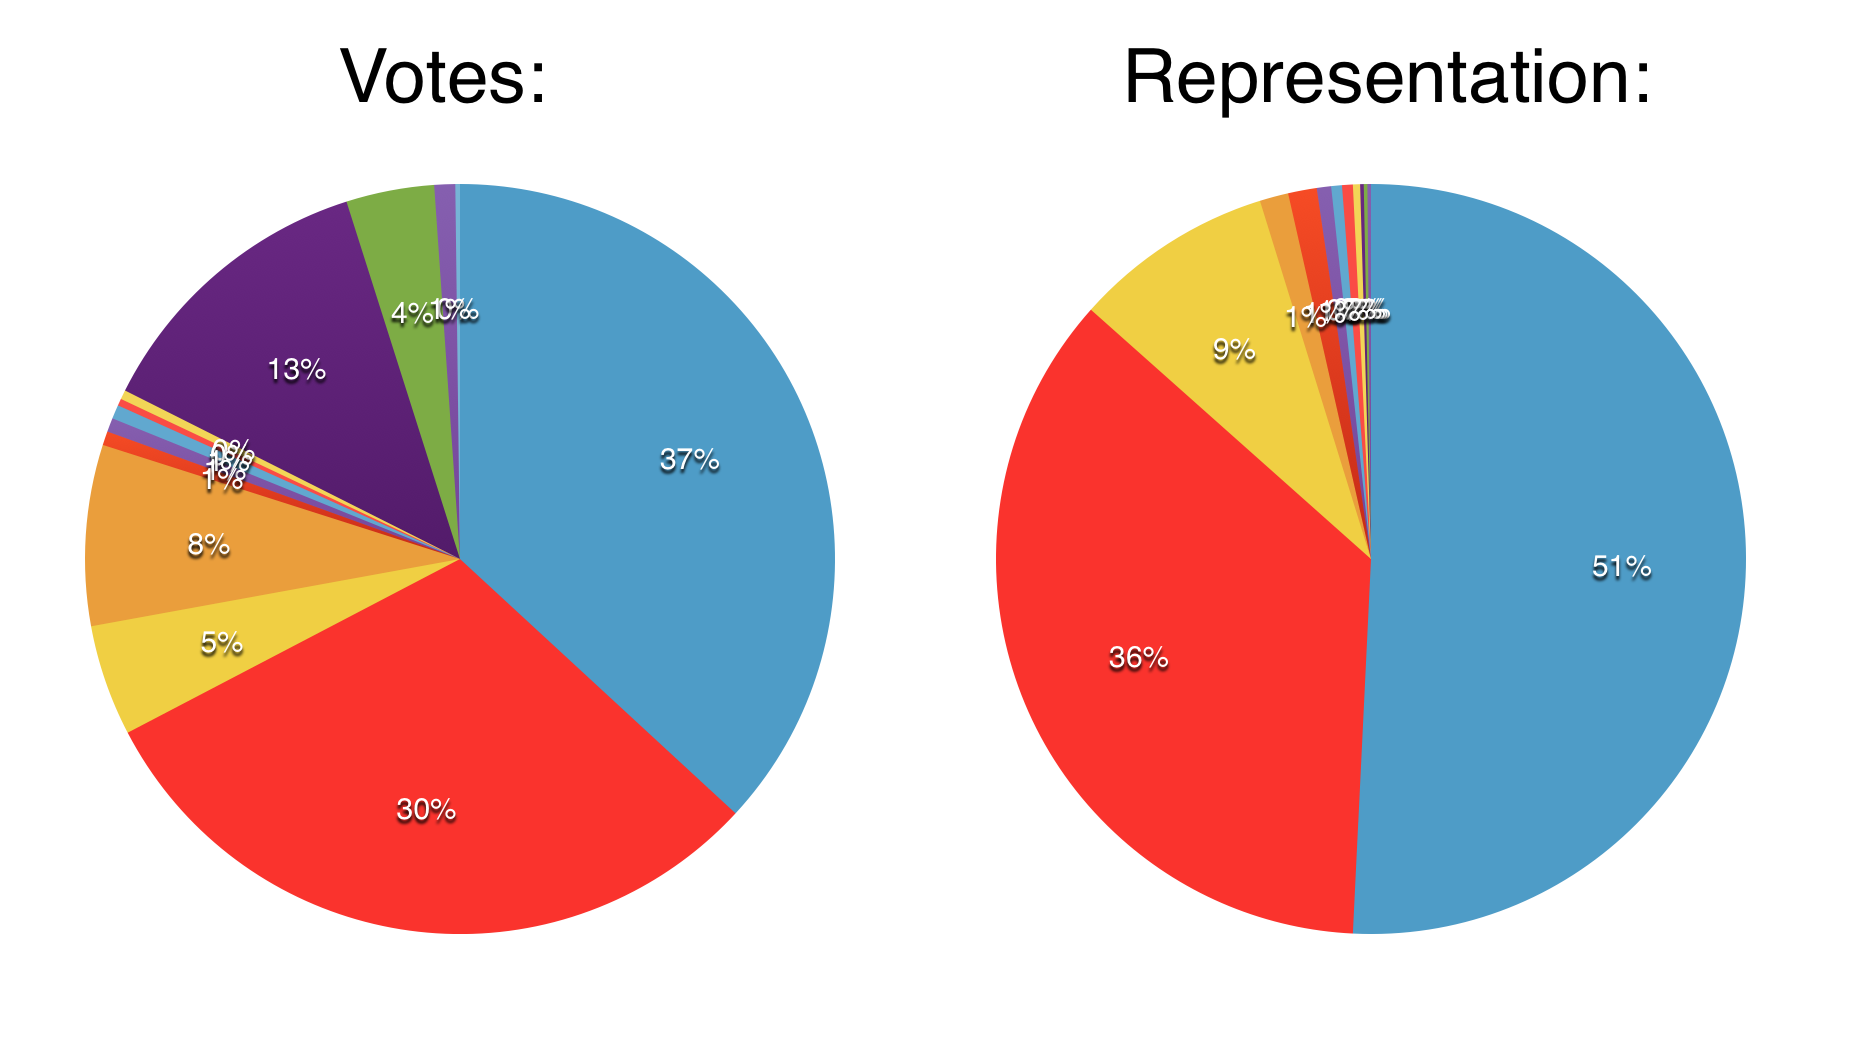
I must say, I was pleasantly surprised that our representation is as good as it is. You can see the fact that smaller parties are punished somewhat while larger ones are rewarded (which is the system working as intended) but overall, the representation is really good. Since parties need to be above the 4% mark to even be considered for the seats, I really should have removed the ones below that line in the left chart but I don’t really feel like it.
People naturally have opinions about the Swedish system as well. There is some legitimate criticism that smaller parties are punished while larger ones are rewarded. This comes from a combination of the 4% barrier and the modification we have to the Sainte-Languë method. I can see the merit of this criticism but I think the system has to promote larger parties. A legislature with too many small parties could be problematic. In my opinion, this system strikes a good compromise between fair representation and practicality. At any rate, it’s definitely better than the UK system!
Reference
If you want to have a boring evening of reading, I would recommend the Swedish election law, that’s where I got my information from. Unfortunately, there are no English translations of the current law so you have to be able to speak Swedish to understand it.
If you want to discuss any of this with me, you can find me on Twitter.
- The national legislative body of Sweden. [return]